You are not authenticated. In order to protect our servers from malicious use, we request you to authenticate before launching any calculation:
Sample size for disease freedom surveillance in laboratory animal facilities using sentinel animals

Disease freedom surveillance in a laboratory animal facility is a common operation required for regular certifications. Simple random sampling is not sufficient because animals are normally isolated from each other in so-called microbiological units and one of the most important objectives is to keep the cost of the surveillance program within limits. A common approach to disease surveillance is through sentinel animals. Cage bed material from randomly chosen cages in the facility is combined into a single cage. Some animals, typically 4, are then housed in that cage and later tested for the presence of the disease. These animals are called sentinels. The rationale is that with relatively few sentinels we can monitor many animals in the original cages. Every 3 months the oldest two sentinels from the cage are analyzed for the presence of pathogens and replaced by two new sentinel animals. This analysis is performed on microbiological units of the animal facility, that is, those animals that share some common area and, therefore, have the same probability of acquiring a disease. This common area can be a ventilated rack (25-100 cages), a room (about 200 cages), or the whole facility (up to 3,000 cages), depending the isolation measures in place. Typical microbiological sizes can go from 100 to 1,000 mice.
In this web we provide some tools to facilitate the calculation of how many sentinel animals we need depending on the prevalence of the disease we want to detect, its transmission, and the test and sampling frequencies. The calculation details are given in ***.
We will distinguish two cases:
- Sampling from a single microbiological unit
- Sampling from multiple microbiological units
Sampling from a single microbiological unit
The following figure represents this problem and defines the variables needed to define the calculations. For simplicity we assume that we take cage bed material every week and perform a sanitary control on the sentinel animals every Nweeks. However, the sampling period can be arbitrary (week, fortnight, month, ...), and Nweeks simply refer to a multiple of that sampling period.
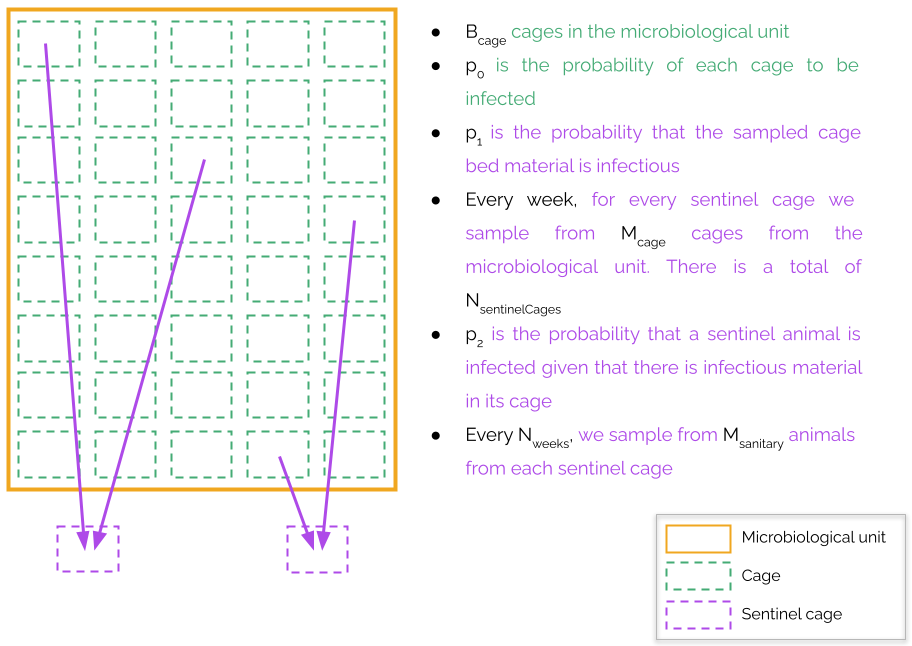
We will assume that there are Bcage cages in the microbiological unit. The probability of a cage being infected will be called p0. We expect that the bed material from an infected cage is infectious. However, this may not be the case for whatever reason (the infection caught in recently, we have been unlucky during the sampling, etc.) We will refer to the probability of the bed material being infectious when we take it from an infected cage as p1. For every sentinel cage, every week we take bed material from Mcage cages from the microbiological unit. These cages should be randomly distributed without replacement within the microbiological unit. There is a total of NsentinelCages and the sampling must be coordinated between the sentinel cages so that the microbiological unit is maximally covered. The next section describes a way of designing a sampling plan. To allow for flexibility we assume that a sentinel animal is not automatically infected given that some of its bed material is infectious. Instead, we will assume that it has a probability p2 of catching the infection. We expect that p0 is low (smaller than 0.1), while p1 and p2 are high (higher than 0.9). However, the user is free to simulate any value for any one of them. Finally, after Nweeks of sampling, we will take Msanitary animals from each sentinel cage and determine the presence of any pathogen, antibodies, or any other biomarker that reveals the presence of a disease in the microbiological unit. We may put the Msanitary animals in the same cage, or in two separate cages whose bed material has been taken from the same cages. This latter situation will be referred to as splitting.. It helps to prevent catastrophic events by which all the animals planned for a sanitary control are lost due to some unforeseen event. If this unforeseen event happens, it may affect one of the sentinel cages, but not both. This splitting helps our surveillance system to be more robust against negative surprises.
Finally, we must fix a confidence level for our detection of the presence of a disease, the confidence is defined as 1-α. Typically, it is fixed to 95%, that is α=0.05. This number should be interpreted as: if the prevalence of the disease in the microbiological unit is p0 and we follow our sentinel sampling plan with parameters p1, p2, Bcage, Mcage, NsentinelCages, Nweeks and Msanitary, then the probability of detecting the disease is larger than 1-α. This probability is calculated by a Monte Carlo simulation in which we computationally reproduce the conditions of the animal facility with these parameters. This process is repeated Nsimulations times, typically in the order of 10,000 times. Note that increasing too much this value overloads our server.
Sampling plan designer
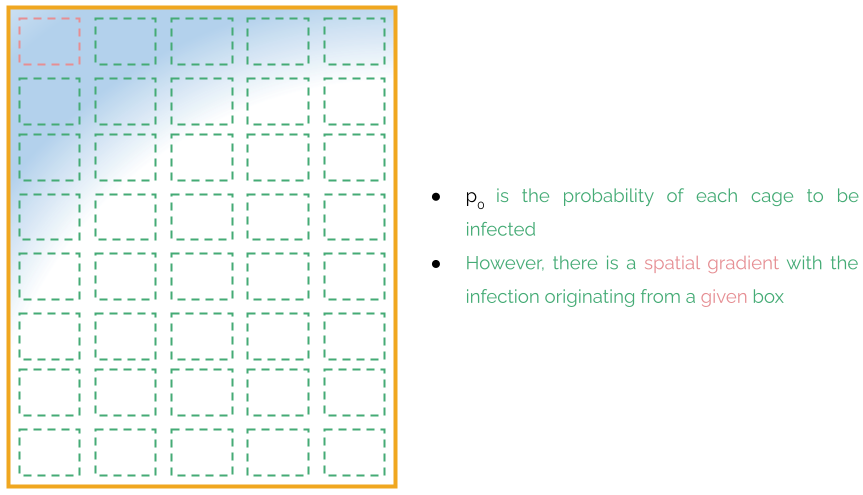
Infections typically start in one of the cages and propagate to nearby cages in the microbiological unit. Although the probability of a cage being infected is pp, cages are not spatially independent, but there is a gradient of probability from the originating cage.
The weekly sampling should try to maximize at each week the area covered within the microbiological unit at the same time that we visit all cages of the microbiological unit. These two criteria are combined into an optimization objective whose details are given in ***.
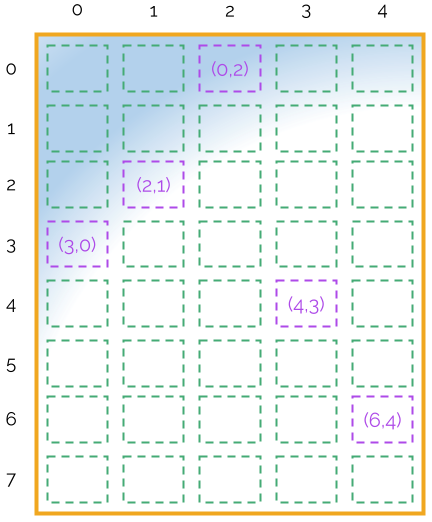
Let us assume that the Bcage cages in the microbiological unit are distributed in an array of NxxNy cages (in the example above, 8x5). Let us also assume that we will have NsentinelCages, and each sentinel cage takes bed material from Mcage cages from the microbiological unit every week. Then, the following plan could be a possibility for Nx=8, Ny=5, NsentinelCages=2, Mcage=5.
S2: (1, 0)(1, 2)(3, 4)(6, 1)(5, 3)
S3: (7, 1)(0, 3)(1, 4)(5, 2)(4, 0)
S4: (3, 1)(6, 0)(2, 2)(0, 4)(6, 3)
S5: (7, 0)(6, 2)(4, 1)(1, 3)(2, 4)
S6: (0, 0)(7, 2)(3, 3)(4, 4)(5, 1)
S7: (5, 4)(2, 0)(4, 2)(1, 1)(7, 3)
S8: (5, 0)(2, 3)(3, 2)(7, 4)(0, 1)
This would mean that for the first sampling of the first sentinel cage we should take the cages (0,2), (3,0), …, (4,3). This is shown in the following figure
With the sample patterns S1-S8 and NsentinelCages=2, we will have for 4 weeks. If we make a sanitary control every 12 weeks, we may repeat this pattern in a randomized fashion:
[S8, S6, S4, S3, S5, S1, S2, S7]
[S8, S7, S2, S4, S3, S1, S6, S5]
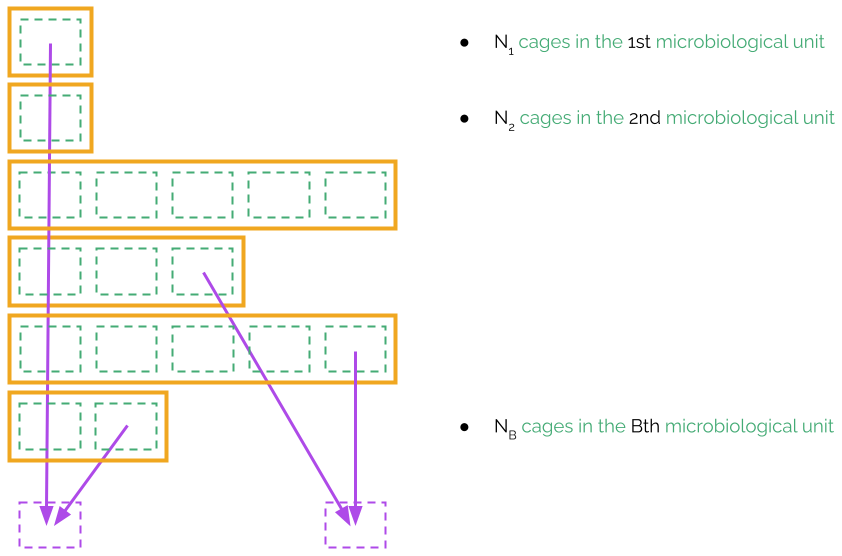
Sampling from multiple microbiological units
In ventilated racks, microbiological units are much smaller as, in principle, each cage is isolated from the other cages. However, sometimes this complete isolation is broken because part of the offspring from the animals of a cage are put into another cage, or animals from the same experiment are manipulated by the same researcher. Whatever the reasons are, microbiological units may now have a much smaller number of cages, and not all microbiological units are of the same size. Let us assume that there are B microbiological units, and let us refer to the number of cages in each unit as N1, N2, ..., NB. The rest of parameters of the sampling keep the same meaning as in the sampling from a single microbiological unit. In particular, we will still have p0, p1, p2, Bcage, Mcage, NsentinelCages, Nweeks and Msanitary.
The sampling plan from multiple biological units may be taken from the previous section simply by assuming that the NxxNy pattern represents the arrangement of the cages of all microbiological units in the shelf.